Forum Replies Created
-
AuthorPosts
-
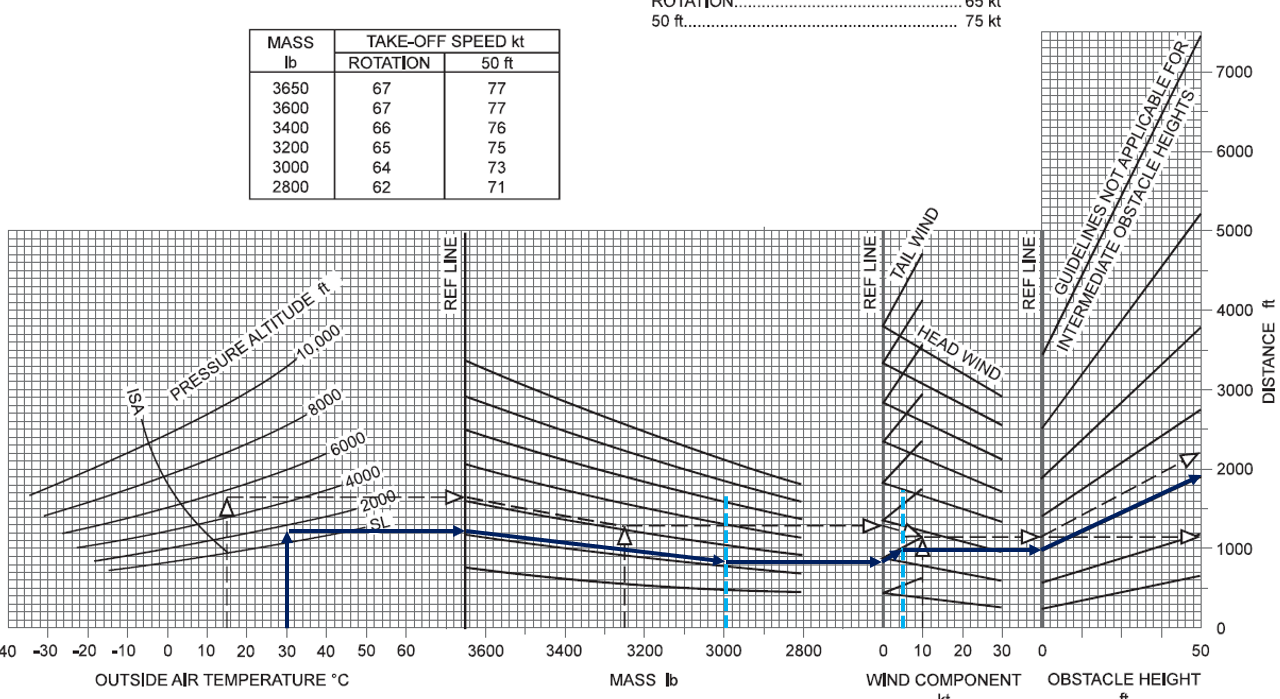
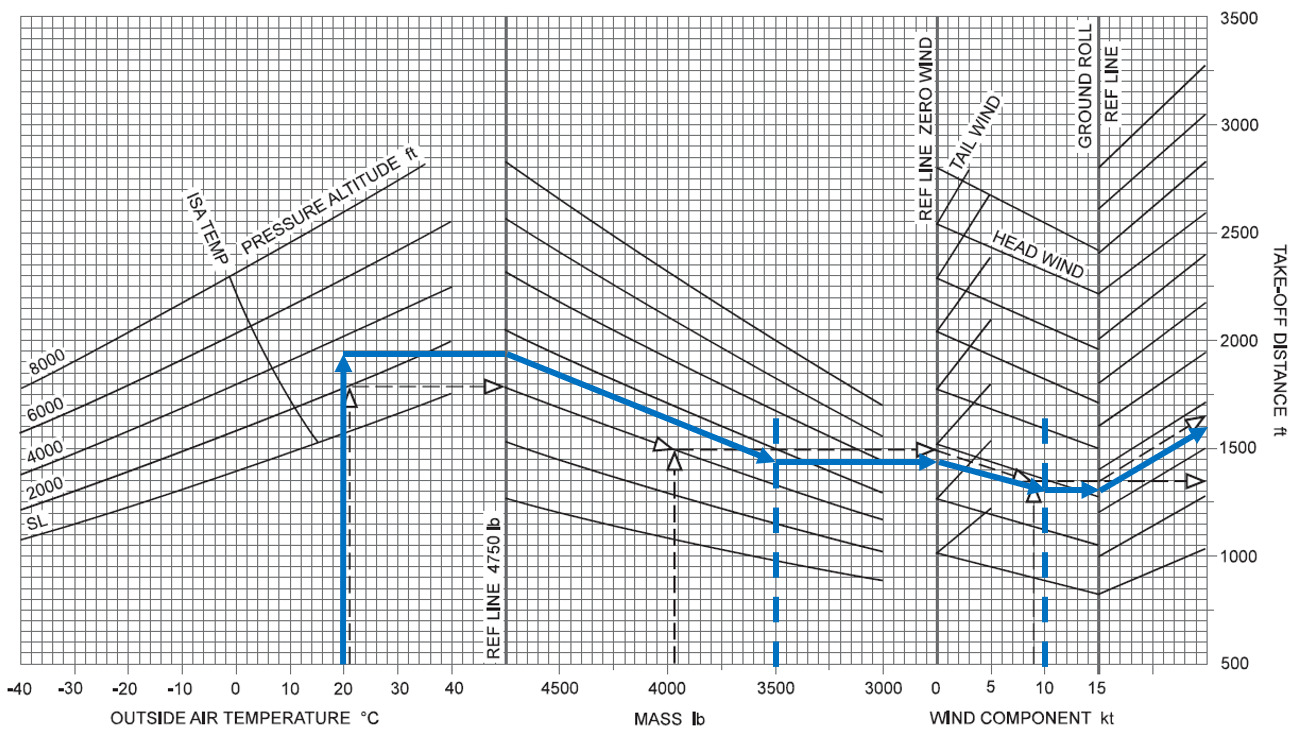
Remember that a tailwind increases your distance and a headwind decreases your distance. A common mistake in this graph is to get them confused and then you will get quite a different result – which is why you are getting a final result under 2000ft.
I get 1900ft from the graph and then multiply the factor of 1.3 for the wet grass – gives me a final answer of 2,470ft
-
This reply was modified 4 years, 1 month ago by
Louise Hahn.
1590ft from the graph X 1.3 (Wet grass) X 1.05 (Uphill) = 2170ft
To work out the % MAC
1. Subtract the new CG from the old CG
- 3m – 2.981m = 0.019m
- So this means the distance has moved forward by 0.019m
2. We when move the CG by 0.019m closer to the leading edge
3. Then take the 0.5 m (which was the distance at 25%) and subtract 0.019m
- 0.5 – 0.019 = 0.481
4. Then finally we work out the % Mac
- 0.481/2 = 24%
The answer will be 24% as the question asked ‘What is the CG as a percentage MAC of the fully loaded aircraft below?’ so although there is an answer of 2.981m it is not correct because it is not at a % MAC
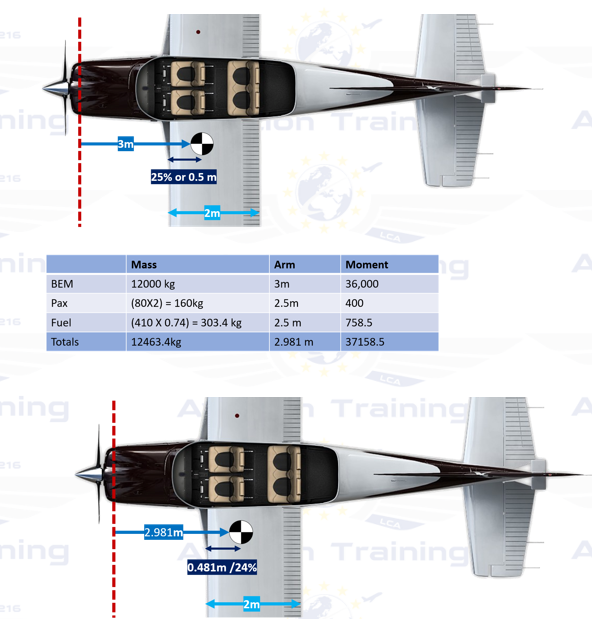
Question Reference: C-FPL-MASSBAL-0025
What is the CG as a percentage MAC of the fully loaded aircraft below?
BEM 12000 kg ; Arm 3 m ; CG 25% MAC ; MAC 2 m
Item Balance arm:
Front seats 2.5 m
Rear seats 3 m
Fuel SG 0.74 Fuel 410 litres Fuel arm 2.5 m
Rear seats Empty Pilot 80 kg Passenger 80 kgThis question is the same as the one above except its in the Southern Hemisphere
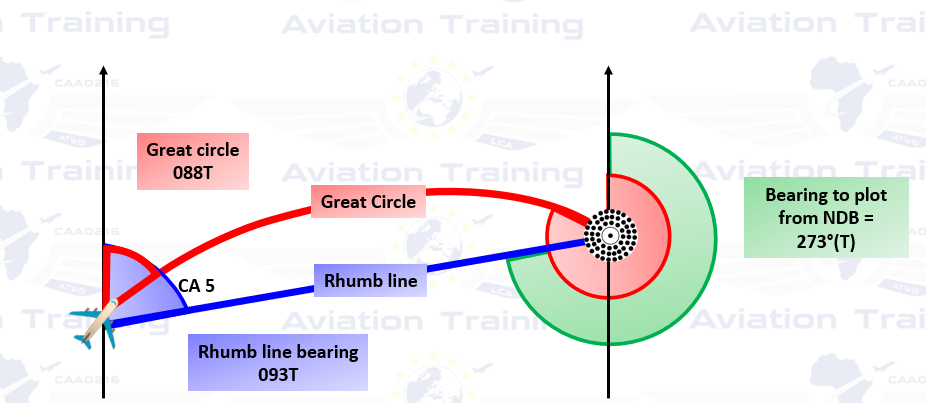
An aircraft in the Southern Hemisphere is flying on a heading of 045°M. The ADF is tuned to NDB ‘Q’ and the RMI reads 090°. Variation at NDB ‘Q’ is 2°E and at the aircraft is 2°W. Earth convergency between the aircraft and the NDB is 10°. What bearing should be plotted from the NDB on a Mercator chart?
Answer: 263°(T)
An aircraft in the Northern Hemisphere is flying on a heading of 045°M. The ADF is tuned to NDB ‘Q’ and the RMI reads 090°. Variation at NDB ‘Q’ is 2°E and at the aircraft is 2°W. Earth convergency between the aircraft and the NDB is 10°. What bearing should be plotted from the NDB on a Mercator chart?
The ‘red herring’ in this case is the aircraft heading. The Radio Magnetic Indicator (RMI) has already resolved the ADF readings and indicates the magnetic bearing of the radio signal i.e. the great circle to the beacon.
Great Circle (radio bearing) to the beacon – 090°M Because the beacon is a NDB, the variation to be applied is the variation at the aircraft
- Great Circle to the NDB = 090°M – 2°W
- Great Circle to the NDB = 088°(T)
- Great Circle bearing to NDB = 088°(T)
- Conversion angle (CA) = ½ EC = ½ x 10 = 5°
- Rhumb line bearing to NDB = 088°(T) + 5°
- Rhumb line bearing to NDB = 093°(T)
- Rhumb line from NDB to aircraft = 093 ± 180°(T)
- Answer : Bearing to plot from NDB = 273°(T)
CC = dlong x sin P of O
Constant of the Cone is sin P of O calculated for you
Straight lines on Lamberts approximate to Great Circles (GC), so you are looking at a GC. If Initial GC is 080 and Final GC is 092 the convergency is the difference between the two = 12 degrees
Going back to your formula for CC
CC = dlong x sin P of O
12 = dlong x 0.8
dlong = 15 degreesFrom 004W you end up at 011E
Geostrophic motion, fluid flow in a direction parallel to lines of equal pressure (isobars) in a rotating system, such as the Earth. Such flow is produced by the balance of the Coriolis force (q.v.; caused by the Earth’s rotation) and the pressure-gradient force. The velocity of the flow is proportional to the gradient of the pressure and inversely proportional to latitude.
Wings that are thin or have sharp leading edges are more efficient ice collectors. For this reason, smaller, thin airfoils may accrete more ice faster than larger, thick airfoils. A large transport aircraft will accrete proportionally less ice than a smaller aircraft traversing the same icing environment.
Also, if the leading edge radius of the wing decreases from root to tip (as it frequently does in swept or tapered wings), the ice accretion will be proportionately greater near the tip. When contaminated with ice, wings with this design may experience flow separation at the tip before the root. Note that this is exactly opposite the way clean wings are typically designed to experience flow separation. Thus, when you fly these types of aircraft, you could lose aileron effectiveness before total wing stall, increasing the probability of an uncommanded roll and greater difficulty in regaining control.
Isohypse (aka height contour)
A line of equal geopotential height. Geopotential assumes the earth is perfectly flat and a perfect sphere. The geopotential height is the distance above the Earth’s surface if it was a perfect and flat sphere. Isohypse are shown on a constant pressure surface. For example, when looking at a 850 mb chart, all isohypses no matter their value are located at 850 mb. Regions of low isohypse values are correlated with low pressure (trough) while high isohypse values are correlated with high pressure (ridge). This 850 chart has height contours. The lines are the isohypses. Above 850 mb, the wind flows close to parallel to the height contours. A curving down of the height contours represents a trough while a curving up a ridge.The question says at altitude, the atmospheric pressure in a column of warm air is likely to be:
The correct answer is higher than at the same height in a column of cold air – See image
-
This reply was modified 4 years, 9 months ago by
While all forms of precipitation start as snow high up in the clouds, there are four primary types that eventually reach the ground: snow, sleet, freezing rain and rain.
Snow occurs when the atmosphere is “cold” all the way from the clouds to down here at the surface.
Sleet and freezing rain form because of a “warm-air sandwich” in the atmosphere above our heads. Precipitation starts as snow in the cold layer at the top, then melts to rain as it falls through the warm layer, then refreezes into sleet or freezing rain as it falls through the cold layer near the surface.
For sleet to occur, the warm air layer is rather thin. A thicker wedge of cold air beneath the warm air refreezes the partially melted snow into ice pellets.
For freezing rain to occur, the warm air layer is thicker. The snow melts into rain then refreezes just as it hits the cold ground.
Since the rain is not freezing until it reaches the surface, it still falls like regular rain and therefore looks and feels the same until it freezes on the ground.
Sleet is made up of ice pellets that bounce off objects. Even though this may sound more hazardous than freezing rain, that’s not the case.
Finally, when the air is warm enough all the way down to the surface, it’s just rain that reaches down here.
-
This reply was modified 4 years, 1 month ago by
-
AuthorPosts